IndieTech’s Interactive Visualization: How Disinvestments Impact Baltimore Communities
At IndieTech Solutions, one way that we empower our partners to craft compelling narratives is by transforming intricate datasets into dynamic interactive data visualizations. Our tailored data visualizations empower partners to influence public policy and opinion.
Partnering with the Justice Policy Institute (JPI), we engineered a new interactive data visualization tool called The Right Investment 2.0 that sheds light on the correlation between Baltimore’s declining population, dwindling investments, and disproportionately high arrest and incarceration rates. Leveraging vast amounts of raw data, we’ve developed a visualization that sheds light on the complex issues within Maryland’s criminal justice system. In its first month alone, we attracted almost 4,000 visitors, demonstrating the value of presenting reports online with interactive data visuals. This accessibility enables easier searchability for media, policymakers, and advocates seeking this information.
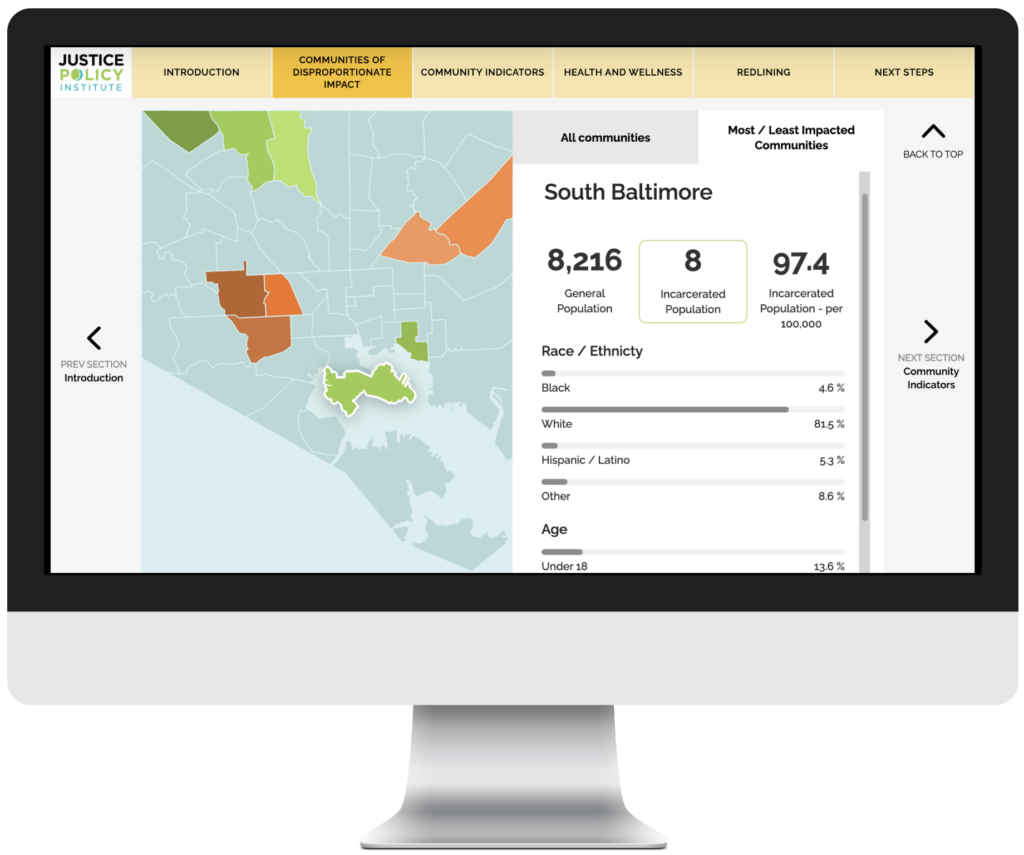
Our visualization aspires to catalyze meaningful conversation and action. Explore The Right Investment 2.0 and reach out if you need assistance taking your reports to the next level! We’re eager to collaborate on data visualization projects for your forthcoming online reports, crafting data-driven narratives that can drive social change. Contact us for further details on our website redesign and ongoing partnerships program.